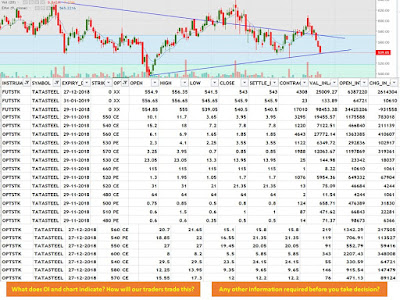
[1:25 PM, 11/25/2018] Balasubramanian: As I see the chart max it will touch 550 spot in this series, so any strike beyond 540 will be worthless. 530PE has more OI. So minimum is placed at 530
[1:26 PM, 11/25/2018] Balasubramanian: Trend line support looks to be around this. But metal stocks based on yesterday's China Market fall are due for still more fall. Till expiry fresh longs can be avoided.
[3:27 PM, 11/25/2018] Amit Nale: 550 560CE have good amount of OI...Its strong resistance level ...May try to touch 550 and reverse
[3:37 PM,
[3:37 PM, 11/25/2018] Harshawardhan: Chance of short Cover
[4:16 PM, 11/25/2018] Priyesh: Looks weak chart as there is higher volumes on sell side.
At present stock is at support levels of 530-35 so there are chances for retracement.
So expect to bounce for 575 levels(50% fibo levels). From that levels can short the stock. If breaks the level of 530(CL Basis) we seen more sell off.
There is Good OI in PE of 500-520 & CE 550 - 570.
We can see the OI range of 520-570
[6:02 PM, 11/25/2018] Ruchi: Double top is there, volume is rising on every decline so chances of going down are high. Its at support. If it breaks, it can go down to 520.
Open Interest is confusing me - please help me with how to interpret Future Open interest.
Options open interest seems like CE contracts are increasing which means that sellers are expecting a fall in price and hence selling CE options.
[6:14 PM, 11/25/2018] Yogesh: Chart bearish, three black crows.
Future OI increase with decrease in price, option heavy call writing with put spread around
[7:01 PM, 11/25/2018] Kiran: There is a clear symmetrical pattern. It is at support level and may move towards resistance level(this can be observed in increase in OI) before it breaks either way. Usually the symmetrical pattern breaks in the direction of the trend. We should trade this pattern on confirmation(breakout).
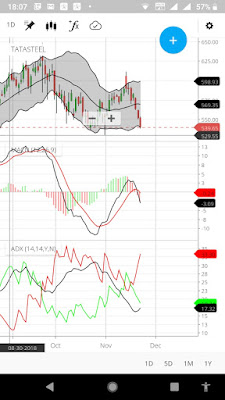
[4:58 PM, 11/25/2018] Shailesh: Strength on -ve side is increasing...
The lower BB is also changing downwards..
[6:06 PM, 11/25/2018] Ganesh: I need to learn OI impact... However gone through global news....
1.Seems steel sector under very much stress globally.....
2. at the same time crude price sharp fall may encourage scope of infrastructure and realty growth in India which may be good for steel industry in our country...
3. Being election ahead... Many more projects may get launched in coming months which may further beneficial for Tata steel to add order book as Tata has already improved operational capacity of production.
Looking at charts.... 531 should be good support level to make it further in uptrend.
[4:32 PM, 11/25/2018] Siddharth: The pattern is a double bottom...which is a reversal pattern.
However we need to check if the trend line acts as support or not...
So incase downward movement continues..we should not take a buy position.
However if the trend line acts as support..then we can take a buy position..
To ensure that trend line is not broken will wait for a 1% upmove..which will be 547 approx.
So will turn a buyer above 547
[4:35 PM, 11/25/2018] Siddharth EqTech-: And a seller below 530
. And I shall use Dec future for this positional trade.
[5:15 PM, 11/25/2018] Hanut:
>Good OI at 550,60,70 CE for November expiry
>Selling candle size and volumes suggest support might not sustain
>November future long unwinding
>December future fresh shorts created
Possible conclusion: might consolidate till November expiry and fall in December
>December if 540 PE Has max OI and does not unwind in next few days and sees further addition then that will make a contradictory view.
[5:25 PM, 11/25/2018] Ajaykumar: When I am looking at chart, I can see that price has reversed multiple times from levels (4 out of 5 times).
And in case of Open Interest
For November expiry highest OI is standing on call side: 570 CE, 560 CE & 550 CE so that will act as resistance.
Highest OI standing on put side is 520 PE, 500 PE so that will act as support
So till November expiry stock should trade between 520 to 550 levels
While seeing Dec OI data highest OI is on 600 CE so that will allow stock to move higher.
So my take
1) Chart says price should reverse from current level
2) Nov series data range bound trade 520 to 550
3) Dec 2018 highest OI on 600 CE so stock should move up in December
[1:48 PM, 11/25/2018] Parag: As per chart - Looking trendline support is there..as per data 560 and 570 CE has maximum OI position... In downside 520 and 500 PE has little OI compare to 560/70 CE.. Now we should buy Tata Steel with SL of 525 Closing Basis and the other side we should book profit near 550/60 level.
[3:48 PM, 11/25/2018] Rahul: From charts it is noticed that stock is in downtrend.. And will continue in downtrend.. As every downside supports by high/good volume
[5:05 PM, 11/25/2018] Ashit: Range - 530 - 570
Major Option activity in 530 & 570 strike.
Close above 560 on a weekly basis can give upper side breakout.
Close below 530 can take it to 480level
Highest open position in Options in 560 call & 520 Put
Highest change in Option open position in 550 call & 560 call & December 600 call
Please note: This is for educational purpose and does not represent any recommendation of buy / sell or hold the stock.


