Sunday, 25 November 2018

Rule Book - Tweezer Top


1) Two candle reversal pattern
2) Appears in Uptrend 
3) Two or more adjacent candles of opposite colour
4) Same high point forming the area of resistance being formed.

Psychology:
1) Though the bulls are trying to push the price higher, but are unwilling to buy above the high point. 
2) Bears action is visible, they take charge at high point and force the price down 

The Tweezer Top can be extremely helpful to traders, because it visually indicates that power is being handed from the bulls to the bears. 


Twizzer Bottom


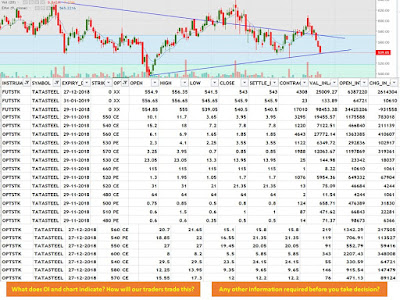
Tata Steel: How our traders are analyzing Chart and OI Data


[1:25 PM, 11/25/2018] Balasubramanian: As I see the chart max it will touch 550 spot in this series, so any strike beyond 540 will be worthless. 530PE has more OI. So minimum is placed at 530

[1:26 PM, 11/25/2018] Balasubramanian: Trend line support looks to be around this. But metal stocks based on yesterday's China Market fall are due for still more fall. Till expiry fresh longs can be avoided.

[3:27 PM, 11/25/2018] Amit Nale: 550 560CE have good amount of OI...Its strong resistance level ...May try to touch 550 and reverse
[3:37 PM, 

[3:37 PM, 11/25/2018] Harshawardhan: Chance of short Cover

[4:16 PM, 11/25/2018] Priyesh: Looks weak chart as there is higher volumes on sell side.
At present stock is at support levels of 530-35 so there are chances for retracement. 
So expect to bounce for 575 levels(50% fibo levels). From that levels can short the stock. If breaks the level of 530(CL Basis) we seen more sell off.
There is Good OI in PE  of 500-520 & CE 550 - 570. 
We can see the OI range of 520-570

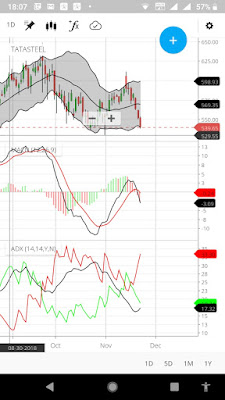
[6:02 PM, 11/25/2018] Ruchi: Double top is there, volume is rising on every decline so chances of going down are high. Its at support. If it breaks, it can go down to 520.

Open Interest is confusing me - please help me with how to interpret Future Open interest.

Options open interest seems like CE contracts are increasing which means that sellers are expecting a fall in price and hence selling CE options.

[6:14 PM, 11/25/2018] Yogesh: Chart bearish, three black crows. 
Future OI increase with decrease in price, option heavy call writing with put spread around

[7:01 PM, 11/25/2018] Kiran: There is a clear symmetrical pattern. It is at support level and may move towards resistance level(this can be observed in increase in OI)  before it breaks either way. Usually the symmetrical pattern breaks in the direction of the trend. We should trade this pattern on confirmation(breakout).

[4:58 PM, 11/25/2018] Shailesh: Strength on -ve side is increasing...

The lower BB is also changing downwards..


[6:06 PM, 11/25/2018] Ganesh: I need to learn OI impact... However gone through global news.... 

1.Seems steel sector under very much stress globally.....
2. at the same time crude price sharp fall may encourage scope of infrastructure and realty growth in India which may be good for steel industry in our country... 
3. Being election ahead... Many more projects may get launched in coming  months which may further beneficial for Tata steel to add order book as Tata has already improved operational capacity of production. 

Looking at charts.... 531 should be good support level to make it further in uptrend.

[4:32 PM, 11/25/2018] Siddharth: The pattern is a double bottom...which is a reversal pattern.
However we need to check if the trend line acts as support or not...
So incase downward movement continues..we should not take a buy position.
However if the trend line acts as support..then we can take a buy position..
To ensure that trend line is not broken will wait for a 1% upmove..which will be 547 approx.
So will turn a buyer above 547

[4:35 PM, 11/25/2018] Siddharth EqTech-: And a seller below 530
. And I shall use Dec future for this positional trade.

[5:15 PM, 11/25/2018] Hanut: 
>Good OI at 550,60,70 CE for November expiry 
>Selling candle size and volumes suggest support might not sustain 
>November future long unwinding 
>December future fresh shorts created 
Possible conclusion: might consolidate till November expiry and fall in December
>December if 540 PE Has max OI and does not unwind in next few days and sees further addition then that will make a contradictory view.

[5:25 PM, 11/25/2018] Ajaykumar: When I am looking at chart, I can see that price has reversed multiple times from levels (4 out of 5 times).

And in case of Open Interest 
For November expiry highest OI is standing on call side: 570 CE, 560 CE & 550 CE so that will act as resistance. 
Highest OI standing on put side is 520 PE, 500 PE so that will act as support
So till November expiry stock should trade between 520 to 550 levels
While seeing Dec OI data highest OI is on 600 CE so that will allow stock to move higher.
So my take
1) Chart says price should reverse from current level
2) Nov series data range bound trade 520 to 550
3) Dec 2018 highest OI on 600 CE so stock should move up in December

[1:48 PM, 11/25/2018] Parag: As per chart - Looking trendline support is there..as per data 560 and 570 CE has maximum OI position... In downside 520 and 500 PE has little OI compare to 560/70 CE.. Now we should buy Tata Steel with SL of 525 Closing Basis and the other side we should book profit near 550/60 level.

[3:48 PM, 11/25/2018] Rahul: From charts it is noticed that stock is in downtrend.. And will continue in downtrend.. As every downside supports by high/good volume

[5:05 PM, 11/25/2018] Ashit: Range -  530 - 570

Major Option activity in 530 & 570 strike.
Close above 560 on a weekly basis can give upper side breakout.
Close below 530 can take it to 480level
Highest open position in Options in 560 call & 520 Put
Highest change in Option open position in 550 call & 560 call & December 600 call

Please note: This is for educational purpose and does not represent any recommendation of buy / sell or hold the stock. 

Wednesday, 14 November 2018

Must Read


Trading Terminology

It is common to trade on tips. It is common to make and lose money randomly. It is common to dream to become quick rich from stock market. It is common to make in ten and go broke in one. It's common to trade emotionally. 

Let's do something unique. Let's face the reality. Without learning, no one has made big in this stock market. 

Hence, we strongly believe in learning the basics. According to us, earning from stock market is simple and easy for a man who has learned the basics thoroughly. There is no complexity / complicated theory to adopt. Just keep it simple - learn the basics.

Basics = Money Management + Risk Profiling + Trading on Method = Money Flow Inwards

TREAT TRADING AS YOUR BUSINESS TO GENERATE INCOME
NOT A RANDOMNESS ACTIVITY TO KILL YOUR BOREDOM

PATTERNS

https://www.youtube.com/watch?v=wm3oPHlNkbE&index=7&list=PLluczokYRNrRzSf6zOHzsaqrhfZF59uw3&t=0s

https://www.youtube.com/watch?v=cZz8rERuJbM&index=10&list=PLluczokYRNrRzSf6zOHzsaqrhfZF59uw3&t=0s
https://www.youtube.com/watch?v=PkUJT6Pzbm0&index=20&list=PLluczokYRNrRzSf6zOHzsaqrhfZF59uw3&t=0s

https://www.youtube.com/watch?v=zyPSY4v5JrM&index=11&list=PLluczokYRNrRzSf6zOHzsaqrhfZF59uw3&t=3s

https://tradingterminology.blogspot.com/2018/10/gaps-rule-book.html

https://www.youtube.com/watch?v=PZLT5i6JABA&index=30&list=PLluczokYRNrRzSf6zOHzsaqrhfZF59uw3&t=0s

https://tradingterminology.blogspot.com/2018/11/four-types-of-gaps.html

https://tradingterminology.blogspot.com/2017/09/basics-of-candlesticks.html

https://www.youtube.com/watch?v=0tRRhDVKpvE&index=4&list=PLluczokYRNrRzSf6zOHzsaqrhfZF59uw3&t=46s

Strategy EMA & Supertrend
https://www.youtube.com/watch?v=mk9s5UlOgDs&index=35&list=PLluczokYRNrRzSf6zOHzsaqrhfZF59uw3&t=2s

https://tradingterminology.blogspot.com/2018/11/strategy-ema-supertrend_7.html

https://tradingterminology.blogspot.com/2017/12/predict-trend-with-ichimoku-cloud-and.html

https://www.youtube.com/watch?v=j6qdruzYPvs&index=8&list=PLluczokYRNrRzSf6zOHzsaqrhfZF59uw3&t=0s

https://www.youtube.com/watch?v=RKvBE80LLJo&index=12&list=PLluczokYRNrRzSf6zOHzsaqrhfZF59uw3&t=0s

https://tradingterminology.blogspot.com/2018/10/morning-star-rule-book.html

https://www.youtube.com/watch?v=7c7CVKzwjBA&index=26&list=PLluczokYRNrRzSf6zOHzsaqrhfZF59uw3&t=13s

https://tradingterminology.blogspot.com/2018/10/how-to-read-open-interest-volume-and.html

https://www.youtube.com/watch?v=nf3LZws1EVo&index=2&list=PLluczokYRNrRzSf6zOHzsaqrhfZF59uw3&t=0s

https://www.youtube.com/watch?v=0z0VuBBXODc&index=13&list=PLluczokYRNrRzSf6zOHzsaqrhfZF59uw3&t=9s

https://www.youtube.com/watch?v=NH358wTTeEw&index=9&list=PLluczokYRNrRzSf6zOHzsaqrhfZF59uw3&t=0s

https://www.youtube.com/watch?v=X8u1_4pbR4s&index=34&list=PLluczokYRNrRzSf6zOHzsaqrhfZF59uw3&t=0s

https://www.youtube.com/watch?v=7y6D20FEbxQ&index=17&list=PLluczokYRNrRzSf6zOHzsaqrhfZF59uw3&t=17s

https://www.youtube.com/watch?v=t_k65UvpEos&index=33&list=PLluczokYRNrRzSf6zOHzsaqrhfZF59uw3&t=0s

https://www.youtube.com/watch?v=VDh5MXvcXjI&index=5&list=PLluczokYRNrRzSf6zOHzsaqrhfZF59uw3&t=11s

https://www.youtube.com/watch?v=6nI3bga1wfU&index=18&list=PLluczokYRNrRzSf6zOHzsaqrhfZF59uw3&t=162s

https://www.youtube.com/watch?v=dT8PPfwXGtU&index=32&list=PLluczokYRNrRzSf6zOHzsaqrhfZF59uw3&t=0s

https://www.youtube.com/watch?v=uuTjtEjSzmQ&index=14&list=PLluczokYRNrRzSf6zOHzsaqrhfZF59uw3&t=7s

https://www.youtube.com/watch?v=ctPjQ0Z_Sis&index=15&list=PLluczokYRNrRzSf6zOHzsaqrhfZF59uw3&t=0s

https://www.youtube.com/watch?v=PmECUHTxGE4&index=31&list=PLluczokYRNrRzSf6zOHzsaqrhfZF59uw3&t=0s

https://www.youtube.com/watch?v=gzDV3u3yK6E&index=29&list=PLluczokYRNrRzSf6zOHzsaqrhfZF59uw3&t=0s

https://www.youtube.com/watch?v=nLoZO3jGCvY&index=28&list=PLluczokYRNrRzSf6zOHzsaqrhfZF59uw3&t=0s

https://www.youtube.com/watch?v=qBY6tNeHaGI&index=16&list=PLluczokYRNrRzSf6zOHzsaqrhfZF59uw3&t=30s

https://www.youtube.com/watch?v=7ugGwTN3iqY&index=19&list=PLluczokYRNrRzSf6zOHzsaqrhfZF59uw3&t=0s

https://www.youtube.com/watch?v=n0mGio_OG4c&index=6&list=PLluczokYRNrRzSf6zOHzsaqrhfZF59uw3&t=4s

https://www.youtube.com/watch?v=ycdq5WkpxDM&index=21&list=PLluczokYRNrRzSf6zOHzsaqrhfZF59uw3&t=0s

https://tradingterminology.blogspot.com/2018/05/how-to-achieve-dispassionate-detached.html

Stop Relying on Human Beings. Start Relying on Candles, Volumes and Patterns

Wednesday, 7 November 2018

Strategy - EMA & Supertrend

My dear friends, on the occasion of Diwali, I wish everyone a very happy and prosperous time. I hope the forthcoming year brings the tremendous happiness and incredible profits for everyone.

On this happy occasion, I would like to share my tried and tested strategy which might give you good profits.

You must have observed many times, most of the stock goes in the consolidation mode and post that give a break out or break down with good strength.  

This strategy I usually use after every quarter during result season. 

In this strategy, we have to use EMA 3,8,14 and Supertrend.

Whenever Supertrend is positive and EMA is above 3,8,14 and the price is sustaining along with good volumes after the consolidation, the breakout with good rally is usually observed.

You might have observed many times, the stock before the results gives good price action either in uptrend or downtrend. And after the results, usually it moves in opposite direction of the general prediction of uninformed traders / public. 

Try applying the strategy said above of Supertrend and EMA on hourly candle to get the better results. 

Attached is SBIN chart as an example. Study and do the backtest with this stock / any other stock to understand how the probability of success ratio of this formula is higher and give positive results.

All the best.


Why stocks fall on good results posting and rise when results are reported bad?


https://www.youtube.com/watch?v=n0mGio_OG4c&t=4s


Tata Motors @172
Supertrend 3 days (blue) Crossed 8 (pink)  and 14 (black)  and after a week its trading today at 195


How perfect this EMA strategy in case of PCJ too -  from 50 to 100 within a week


Monday, 5 November 2018

Four Types of Gaps

Gap occurs because of three reasons: marketwide events (political event, terrorism attacks, commodity price shocks), sector specific event (interest rate / currency change impact) and company related event (change in management / acquisition / approval of product).


Four Types of Gaps

Higher volatility in stocks bring more gaps in price action. 

Study - location, size and volumes of the gap to capture the profitable trading opportunities

Common Gap / Trading Gap / Area Gap
  • Uneventful Gap
  • Usually get filled quickly
  • Common occurrence in trading range scenario / congestion area
  • Usually low trading volume on such gaps creation
  • Not big in size
  • Scalping Trades


Breakaway Gaps
  • Breaking out from pattern / trading range / support / resistance levels
  • Such gaps occurs at the beginning of a trend
  • Higher volumes accompany such gaps
  • Takes time - may be years - to fill such gaps
  • Higher timeframes more reliable
  • Big moves expected


Runaway Gaps / Measuring Gaps / Continuation gap
  • Occurs in middle of trend
  • Interest buildup in stock because of significant news 
  • Panic based execution of trades by traders in order to avoid missing on the opportunity. 
  • According to Bulkowski, runaway gaps occurs on 43% from the beginning of the trend and in a downtrend gap occurs at 57% distance


Exhaustion Gap
  • Occurs at the end or near end of the major trend
  • Huge price difference with extreme high volumes (exchange of hands)
  • Usually represents reversals on the cards after this gap
  • Usually quick in filling the gap because of trend reversal
  • Higher chances of stock going in consolidation mode or reversal after this gap appearance


Points to remember
  • Difference between runaway gap and exhaustion gap is in volumes. Both are supported with good volumes. However, extreme high volumes activity with immediate drying of interest combined with reversal candles is associated with exhaustion gap
  • All gaps are filled. Common and Exhaustion gaps comparatively fill faster than runaway or breakaway gaps
  • Though it is believed that all gaps are filled, but the time taken cannot be explicitly defined. There is a possibility that gaps are not filled for years or sometimes partially filled for quite longer period of time. 
  • Illiquid stocks create many regular gaps by touching the circuits day after day. Avoid trading in such stocks because of lack of volumes
  • Corporate action (ex dividend / bonus) gaps does not indicate much because there is no change in demand supply ratio
  • Breakaway and measuring gaps should be traded in the direction trend of the gap

Sunday, 4 November 2018

My Trades - November 2018


[11/6, 7:02 AM]: *Nifty* -

*Outlook* - Range Bound

*Strategy* - Buy Supports &  Sell Resistance

🔵 10460

🔵 10428

🔴 10497

🔴 10549

🔴 10655

🔴 10669

🔴 10700

🔮Nifty - Consolidation period - Should attempt trading correlations stocks - Option writing strategy should work well.
____________________________
*Stocks*

*Exide Industries* -

🔵Buy - 245/247

🔴Stoploss - 239( CL)

🎯Tgt - 254, 259, 264


___________________________

*IGL*

STRONG BUY - 268

TGT - 320

POSITIONAL


[11/7, 2:18 PM]: *Diwali Scalp Shots* 💥

🔮Tata Motors - 190.70

🔮 Voltas - 513.10

🔮 DLF - 169.20

🔮 Can bank - 237.10

🔮 Yesbank - 211.50

🔮 Relinfra -  351.20

🔮Pc Jewellers - 77.10

🔮SBIN - 281.40


All above are trigger points and can easily give you 2/ 3 points on bounce

Best wishes for Muhurat trading -

🎊🎊🎊🎊🎊🎊🎊🎊🎊

[11/9, 1:33 PM]: Indiacem


🔵Buy 98.10

🔴Stoploss - 96.80 ( cl)

Target 101, 103

[11/10, 11:26 AM]: ICICIBANK - Standing tall and positive - expected to breakout and can se single day rally

Since it's Nifty participant it's the one which can take Nifty higher -

So we expect Nifty to move higher then - it's the important ingredient

[11/10, 9:24 AM]: One more thing which one should see the open Interest -
Since most of open Interest of ICICIBANK is 360 370 380

suggestion

ICICIBANK may see spike and then cool down to add more open Interest from retail and then in turn expiry below - 360 to eat all

[11/10, 9:25 AM]: So be active in following short term moves -

Apply formula on 5 mins - 3,8,14 ema to stick to Operators move

[11/10, 11:42 AM]: 📌5 Consecutive Days - Candles hitting super trend and not able to close above -

📌Important Resistance - 10655, 69 ,700

📌Traders might turn buy side above the said points to play gap near 800

📌 Hdfc, indusind, ICICIBANK - Key ingredients to take Nifty up...Charts have consolidated well to advance new move

📌Options writing - Returns are huge - on individual stock -
Check for false premium - some scrips options are trading even 40% to Intrinsic value before results

My take -

*Nifty*


Current - 10585


🔵 10655/ 700


🔴 10460


🔵 10850


All can happen on Gap - trading - as flat opening is unsuccessful to capture momentum


Sunpharma - 591.50 buy ( Monday)


Titan - Monday 🔵Buy + 838

[7:20 AM, 11/12/2018]: Pcjeweller - 🔵Buy - 91.10/90.10 - Target - 106, 107 - 112


[8:46 AM, 11/15/2018]: Good Morning -

There have been many situations when stock have fallen - suddenly - its all happens when stocks are highly recommended on board -

Pharma stocks - has been  considered as goodest best since last once year at current rates - & performance been neutral ;

It's is always a possibility of chucking the rangers out from range feild -

Sunpharma : May not perform for going month as loads of longs recommended at higher levels - till the time longs unwind stock will take time to recover to previous levels

Suggestion

📌Stay on delivery - and wait for right time - to get the levels -

📌Future - write calls

📌 (493 -524) band


[9:13 AM, 11/16/2018]: DHFL - Moving target - 251

[1:55 PM, 11/16/2018]: Igl 

Buy - 263.50

Positional Cash Trade 

SL: 249

For target of 320

[6:30 PM, 11/16/2018]: India cement - Inverted H&S - Pattern - Can see strong move once close  above - 96.80


[8:44 AM, 11/17/2018]: Nifty - Close to Gap fill-in / Dow Jones positive close with trend intact -


[9:04 AM, 11/17/2018]: Bharti Airtel- Triple Bottom - Reversal


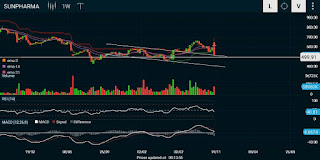
[9:30 AM, 11/17/2018]: Sunpharma - Stock is trying to hold trendline - Not standing the resistance point of 525/28 Band - Can break - 499 levels to make short term base of 493


[11:14 AM, 11/18/2018]: HDFC bank

📌Last four days strong upmove - Nifty mover - Range - 1910 to 2008.

📌 Nifty sustaining the gap needs participants ; One of the strong contender - 

📌1992 - 3 / Strong support zone - May reverse to carry the uptick ,breaking price band -

📌Price target hitting supertrend for consolidations - 2023/40

📌Crucial period - Elections - 5 states -Results - 11 Dec

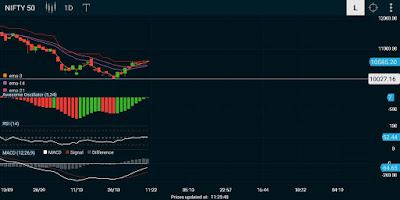
📌Nifty near 10900 - Decisive point for further move -

📌 International markets largely range bound - 

📌Tech- Stocks may look for larger move - trending nifty 

📌Stay hedged on trade and short term targets with strong SL - works to be better strategy


Join us by entering your data here
Please mention "Trading Terminology Blog" in Reference Textbox

We will add you as soon as your information is approved by our team.