Saturday, 16 February 2019

Friday, 8 February 2019

Gurukul, Your Personal Trading Coach


Why Gurukul?

There are about 5 Crs. pages thrown by Google when you search "How to Earn Money" India stands at Rank 3 followed by Nepal and Pakistan for the search term "How to Earn Money" Yet many of us in spite of availability of immense information on our finger tips, we find it difficult to earn money.

Stock Market is the place where easy money is available. Easy to earn for learner's. Easy to lose for others. As we have developed the skills by continuous and rigorous training self over the years about how to sustain in stock market, we believe we can extend the help in this field.

Under Gurukul, our aim is to show you how we make money from stock market. We trade with you to help you learn the subject and grab the money on the road. 

What is Gurukul?

Gurukul, Your Personal Trading Coach, is an initiative taken by Trading Terminology Team in association with Standard Securities Team to bring the mixture of "Learning and Earning" on the table. It is a highly absorbable focused initiative that gifts you a razor sharp eye to pick trades like masters.

Who can join Gurukul?

Everyone who can open the account for investments and trading under the purview of legislation

How to join Gurukul?

Send request to tradingterminology@gmail.com
We will send you the account opening formalities
Once the account is opened, transfer liquid funds and current holdings
Connect to tradingterminology@gmail.com once the above is done.
We will connect with you to understand your risk profile, trading activities and your current market understanding
Post this conversation, we will take a step forward in the journey of Earning and Learning

What if I do not have any liquidity currently. But can arrange cash in next month?

No issues. Start the procedure of opening the account. Transfer your existing holding to your client code in Standard Securities. Get the portfolio reviewed by us and proceed on the journey

What if I do not hold any shares?

No issues. You can start account with the cash liquidity available with you.

What if I neither have any liquidity nor shares?

Avoid opening the account.

What if I have XXXXXXX invested in shares and XXXXX lquidity available but I wish to see the performance and working style of Gurukul Team. So can I transfer XX amount and shares worth of XXX for evaluation purpose?

We will share ideas based on the amount and shares reflecting in your account under Standard Securities.

What is the return can be generated? Is there any guaranteed return?

Investment in stock market is subject to market risks. There is no guarantee of any return generated. Infact, there is a possibility that your entire capital can be lost in stock market. Do the market research on the implications both (upside and downside) possibilities before connecting with us.

How many trades will happen in the month?

There is no fixed number of trades that can be defined. Number of trades are directly proportional to the opportunities available which falls under your investment amount, risk appetite & your market understanding

What are the brokerage charges?
0.20 & 0.02

What is the fees for the guidance provided all along?
Blessings

We urge you to join us and learn how we make money. We urge you to spread the word amongst all your known ones to join us and see how the wealth is created.

Find us on
Youtube Channel
https://www.youtube.com/channel/UCRjxsfKRsf1I0_BPljmRQqA

Facebook Page
https://www.facebook.com/tradingterminology/

To join us on whatsapp group
https://goo.gl/forms/YPb6SCkbpnQNCH763

Please note: it is for educational purpose and we will define how we make money from stock markets.

So what you are waiting for? Join us by sending a request to tradingterminology@gmail.com and see the difference for yourself. Our hobby is to make money. What is yours?

Tuesday, 1 January 2019

Daily Study - 2 Jan 2019


Join our Trading Room - Free. Click here to show your interest

Disclaimer: These are for studies purpose. Contact your financial advisor to guage if the trade can fit in your money management and risk profiling

Thursday, 27 December 2018

Market Overview - 28 December 2018

Dow Jones  - Technical Bounce -Strong recovery from 21635 to 23150 - Strong Resistance now  23548, Need to sustain at current levels to prove strength, Volatility expected to continue.

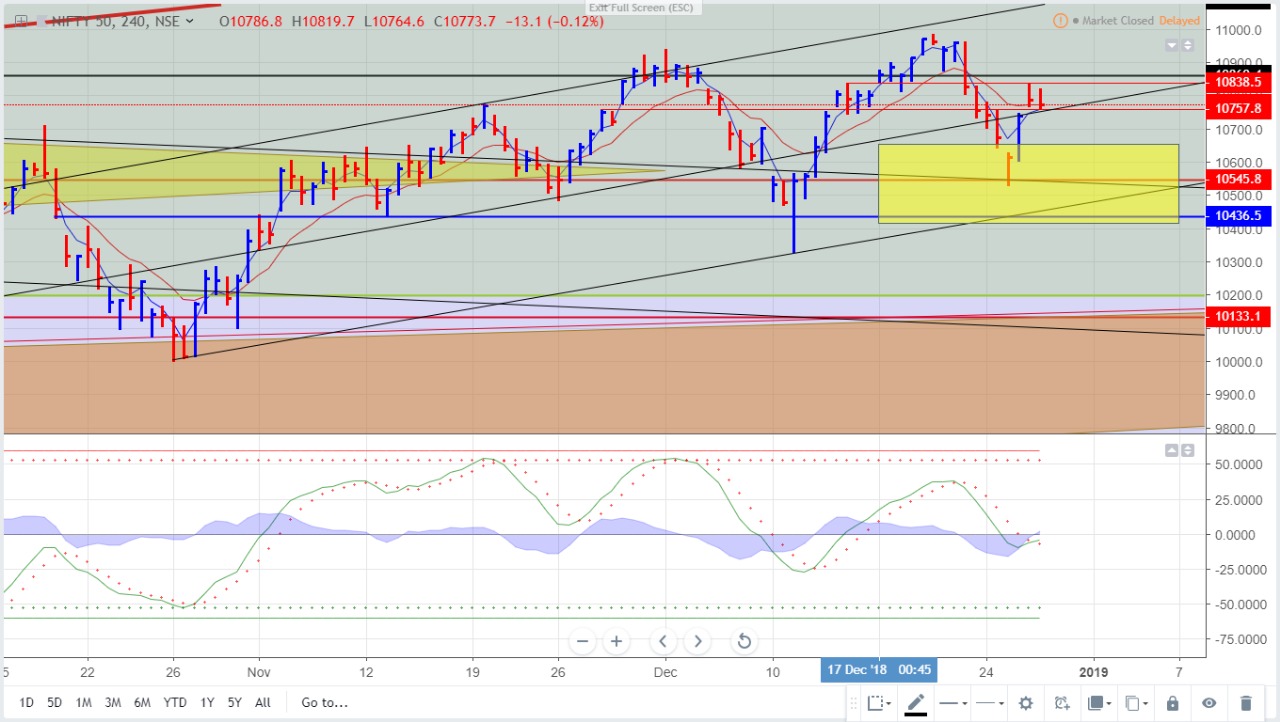
NIfty Strong Support ( Today)  - 10742  ,Sustaining which could bring back the upward momemtum  - R1 - 10817, R2 10840 - Strong Bull grip above - 10888, However  - testing 10624 before any upward breakout journey is likely


Bank Nifty  - Lower High - Formation - Strong Support Area - 26660/- Closing below short term trend bearish - / Strong R1 - 27036


Pc Jewellers | Sector: Consumer Cyclicals | Industry: Apparel & Accessories

PC Jeweller Limited is a jewelry company. The Company is engaged in the business of manufacture, retail and export of jewelry. It offers a range of products including 100% hallmarked gold jewelry, certified diamond jewelry and other jewelry, including silver articles, with a focus on diamond jewelry and jewelry for weddings

Financials
Valuation
Market Capitalization 33.604B
Enterprise Value (MRQ) 27.447B
Enterprise Value/EBITDA (TTM) -29.6271
Total Shares Outstanding (MRQ) 358.2M
Number of Employees 3.071K
Number of Shareholders 69.197K
Price to Earnings Ratio (TTM) 8.3688
Price to Revenue Ratio (TTM) 0.7973
Price to Book (FY) 0.8652
Price to Sales (FY) 0.333


Buy  - 83.10 SL - 80.40 CL , target  92, 107

VGuard | Sector: Industrials | Industry: Electrical Components & Equipment
Employees: 2096
V-Guard Industries Limited (V-Guard) is an India-based company engaged in manufacturing, trading and selling of electronic products. The Company's segments include Electronics, Electrical/Electro Mechanical and Others. V-Guard's Electronics segment includes products, such as voltage stabilizers, uninterruptible power supply (UPS) and digital UPS. The Company's Electrical/Electro Mechanical segment includes products, such as PVC Cables, Pumps and Motors, Electric Water Heaters, Fans, Switchgears, Induction Cooktops and Mixer Grinder.

Financials
Valuation
Market Capitalization 99.856B
Enterprise Value (MRQ) 95.999B
Enterprise Value/EBITDA (TTM) —
Total Shares Outstanding (MRQ) 426.411M
Number of Employees 2.096K
Number of Shareholders 75.857K
Price to Earnings Ratio (TTM) —
Price to Revenue Ratio (TTM) —
Price to Book (FY) 13.2874
Price to Sales (FY) 4.14


Buy 222.10 , sl 213, target 257

Join us to get daily trade set ups. Share your requirements at tradingterminology@gmail.com

Monday, 3 December 2018

Trades - December 2018

[12/3, 7:41 AM]: *Levels to watch for - 3 December 2018*

*Amaraja Battery*

🔴 719.10
🚫 725
🎯 705.40, 699

*Ashok Leyland*

Gap between 114.15-117.10

🔴 114.60
🚫 115.60
🎯 111.50

🔵 111.10
🚫 109.80
🎯 113.20, 114.40

*Auro Pharma*

🔵 802.20, 786
🚫 780
🎯 823/7

*Exide Industries*

🔵 259.89
🚫 254
🎯 266,270


[12/3, 11:36 PM]: *Levels to watch - 4 December*

*India Cement*

🔵 96.60
🚫 95.20 CL
🎯 100.80

*Yes Bank*

🔵 173.50
🚫 171.10
🎯 182.50

Midcap - Caution. Struggling 17200 SS/ Breaking 📌 16690
🔥 14966

Sunday, 25 November 2018

Rule Book - Tweezer Top


1) Two candle reversal pattern
2) Appears in Uptrend 
3) Two or more adjacent candles of opposite colour
4) Same high point forming the area of resistance being formed.

Psychology:
1) Though the bulls are trying to push the price higher, but are unwilling to buy above the high point. 
2) Bears action is visible, they take charge at high point and force the price down 

The Tweezer Top can be extremely helpful to traders, because it visually indicates that power is being handed from the bulls to the bears. 


Twizzer Bottom


Tata Steel: How our traders are analyzing Chart and OI Data


[1:25 PM, 11/25/2018] Balasubramanian: As I see the chart max it will touch 550 spot in this series, so any strike beyond 540 will be worthless. 530PE has more OI. So minimum is placed at 530

[1:26 PM, 11/25/2018] Balasubramanian: Trend line support looks to be around this. But metal stocks based on yesterday's China Market fall are due for still more fall. Till expiry fresh longs can be avoided.

[3:27 PM, 11/25/2018] Amit Nale: 550 560CE have good amount of OI...Its strong resistance level ...May try to touch 550 and reverse
[3:37 PM, 

[3:37 PM, 11/25/2018] Harshawardhan: Chance of short Cover

[4:16 PM, 11/25/2018] Priyesh: Looks weak chart as there is higher volumes on sell side.
At present stock is at support levels of 530-35 so there are chances for retracement. 
So expect to bounce for 575 levels(50% fibo levels). From that levels can short the stock. If breaks the level of 530(CL Basis) we seen more sell off.
There is Good OI in PE  of 500-520 & CE 550 - 570. 
We can see the OI range of 520-570

[6:02 PM, 11/25/2018] Ruchi: Double top is there, volume is rising on every decline so chances of going down are high. Its at support. If it breaks, it can go down to 520.

Open Interest is confusing me - please help me with how to interpret Future Open interest.

Options open interest seems like CE contracts are increasing which means that sellers are expecting a fall in price and hence selling CE options.

[6:14 PM, 11/25/2018] Yogesh: Chart bearish, three black crows. 
Future OI increase with decrease in price, option heavy call writing with put spread around

[7:01 PM, 11/25/2018] Kiran: There is a clear symmetrical pattern. It is at support level and may move towards resistance level(this can be observed in increase in OI)  before it breaks either way. Usually the symmetrical pattern breaks in the direction of the trend. We should trade this pattern on confirmation(breakout).

[4:58 PM, 11/25/2018] Shailesh: Strength on -ve side is increasing...

The lower BB is also changing downwards..


[6:06 PM, 11/25/2018] Ganesh: I need to learn OI impact... However gone through global news.... 

1.Seems steel sector under very much stress globally.....
2. at the same time crude price sharp fall may encourage scope of infrastructure and realty growth in India which may be good for steel industry in our country... 
3. Being election ahead... Many more projects may get launched in coming  months which may further beneficial for Tata steel to add order book as Tata has already improved operational capacity of production. 

Looking at charts.... 531 should be good support level to make it further in uptrend.

[4:32 PM, 11/25/2018] Siddharth: The pattern is a double bottom...which is a reversal pattern.
However we need to check if the trend line acts as support or not...
So incase downward movement continues..we should not take a buy position.
However if the trend line acts as support..then we can take a buy position..
To ensure that trend line is not broken will wait for a 1% upmove..which will be 547 approx.
So will turn a buyer above 547

[4:35 PM, 11/25/2018] Siddharth EqTech-: And a seller below 530
. And I shall use Dec future for this positional trade.

[5:15 PM, 11/25/2018] Hanut: 
>Good OI at 550,60,70 CE for November expiry 
>Selling candle size and volumes suggest support might not sustain 
>November future long unwinding 
>December future fresh shorts created 
Possible conclusion: might consolidate till November expiry and fall in December
>December if 540 PE Has max OI and does not unwind in next few days and sees further addition then that will make a contradictory view.

[5:25 PM, 11/25/2018] Ajaykumar: When I am looking at chart, I can see that price has reversed multiple times from levels (4 out of 5 times).

And in case of Open Interest 
For November expiry highest OI is standing on call side: 570 CE, 560 CE & 550 CE so that will act as resistance. 
Highest OI standing on put side is 520 PE, 500 PE so that will act as support
So till November expiry stock should trade between 520 to 550 levels
While seeing Dec OI data highest OI is on 600 CE so that will allow stock to move higher.
So my take
1) Chart says price should reverse from current level
2) Nov series data range bound trade 520 to 550
3) Dec 2018 highest OI on 600 CE so stock should move up in December

[1:48 PM, 11/25/2018] Parag: As per chart - Looking trendline support is there..as per data 560 and 570 CE has maximum OI position... In downside 520 and 500 PE has little OI compare to 560/70 CE.. Now we should buy Tata Steel with SL of 525 Closing Basis and the other side we should book profit near 550/60 level.

[3:48 PM, 11/25/2018] Rahul: From charts it is noticed that stock is in downtrend.. And will continue in downtrend.. As every downside supports by high/good volume

[5:05 PM, 11/25/2018] Ashit: Range -  530 - 570

Major Option activity in 530 & 570 strike.
Close above 560 on a weekly basis can give upper side breakout.
Close below 530 can take it to 480level
Highest open position in Options in 560 call & 520 Put
Highest change in Option open position in 550 call & 560 call & December 600 call

Please note: This is for educational purpose and does not represent any recommendation of buy / sell or hold the stock. 

Join us by entering your data here
Please mention "Trading Terminology Blog" in Reference Textbox

We will add you as soon as your information is approved by our team.